Introducing the water industry’s most advanced N2O solution that simplifies and accelerates the decarbonization journey. Cobalt Water Global’s N2ORisk DSS can simplify the N2O reduction journey from the beginning to any point in the journey by providing a single source of AI/ML insights for accounting of N2O emissions (getting a realistic picture of a wastewater treatment facility’s N2O emissions before physically monitoring N2O), identifying opportunities to reduce N2O, then physically monitoring N2O to verify current emissions, implementing identified mitigation strategies to reduce N2O, and monitoring the process and N2O emissions to ensure reductions and progress towards net zero emission is maintained.
Step 1
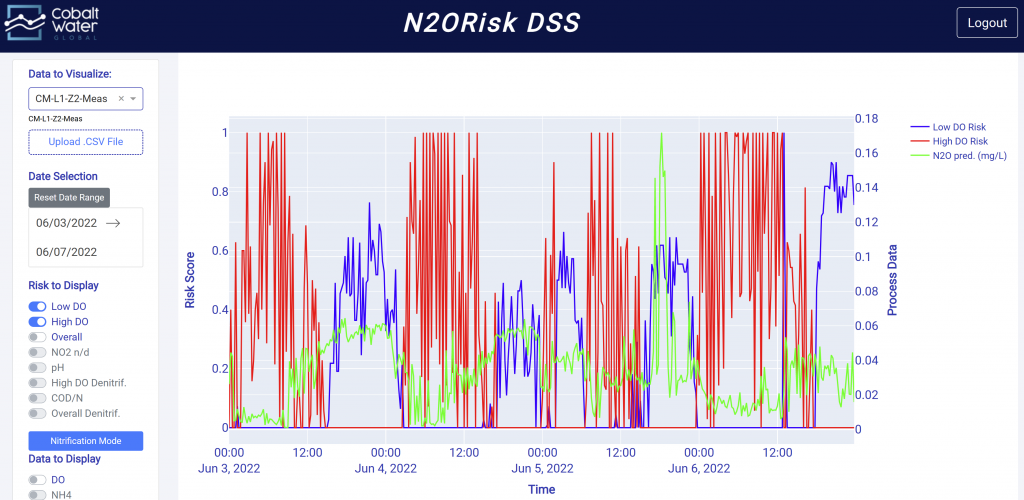
ACCOUNTING and ASSESSING N2O
Your N2O journey starts with getting a realistic picture of what your wastewater treatment plant’s N2O emissions are. Without the N2ORisk DSS platform, this is not possible. Why? Because generic emission factors from IPCC and all the accepted protocols out there are not consistent with the science behind wastewater N2O process emissions and cannot capture the site-specific process conditions in the biological treatment reactors, which is where N2O is produced. If you are using mechanistic models and have not calibrated them with site-specific data, then the research has shown that default or random model parameter values are not capable of accurately representing actual N2O production and emissions.
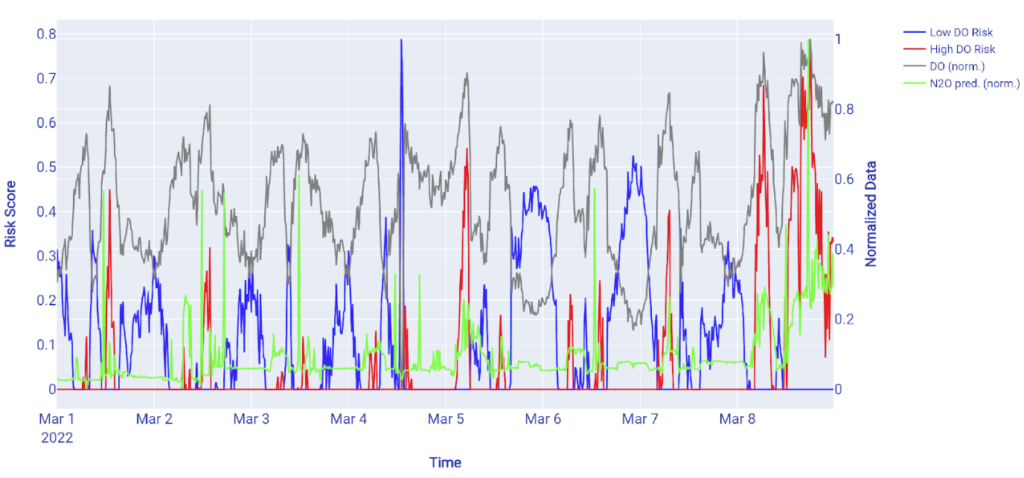
The N2ORisk DSS looks at your site-specific process data to understand what is happening in the treatment reactors, and uses machine learning to make science-based estimates of N2O emissions as opposed to what is simply coming in or what the delta is (like generic emission factors do), which is scientifically incorrect. Once you have identified which sites have the highest emissions, the platform uses knowledge-based AI to generate a dynamic risk profile so you can see why N2O is being produced based on the knowledge of N2O pathways and influencing factors, and identifies opportunities to reduce N2O. You can then prioritize which sites to go and measure and reduce N2O.
Once you have accounted for and assessed opportunities to reduce N2O, the next step in N2O reduction journey is measuring and reducing N2O.
Select the field measurement method for N2O emissions that best meets your objectives and use process and N2O knowledge to select monitoring locations. We are experts in measuring wastewater N2O process emissions by the way and can help.
Once you have confirmed emissions and previously identified reduction opportunities, you can implement the recommended control actions to reduce N2O and measure the reductions.
With the measured N2O data you can train a site-specific machine learning model and also look at seasonal variation in emissions with historical data and check that you are also reducing N2O in parallel treatment trains.
Step 2
MEASURING and REDUCING N2O
Step 3
MONITORING THE PROCESS and N2O EMISSIONS
Once you have reduced N2O, you want to continuously monitor the process and continuously reduce N2O, because conditions can change.
After a month of physically measuring N2O, you can use the trained machine learning model to monitor emissions going forward and monitor risk with the knowledge-based AI to make sure you are continuously reducing N2O. If predicted N2O increases, you will know why and can take immediate action to bring N2O emissions back down. Ideally this should be checked on aweekly basis so you don’t have more than a week of increased N2O emissions. Monthly emissions reports can also easily be generated with the platform to track progress towards net zero goals.
See the most advanced N2O solution in action
Schedule a demo and we’ll show you how easy it is to elevate your N2O game.